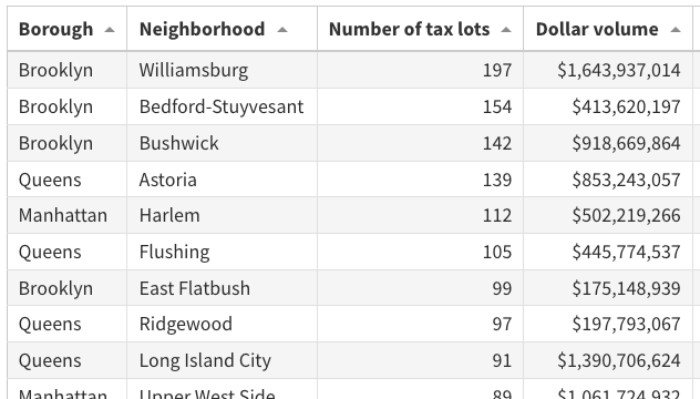
Williamsburg, Bed-Stuy most active by number of transactions over past year: Analysis of 50 neighborhoods

Top 50 Neighborhood Analysis by Number of Properties Sold

By Adam Pincus

Williamsburg and then Bedford-Stuyvesant have been the most active neighborhoods in the city in terms of the number of commercial properties sold over the past 12 months, according to an analysis by PincusCo.

They were followed in order by Bushwick, Astoria and then Harlem, to round out the top five. Those five neighborhoods accounted for 744, or about 14 percent of the approximately 5400 commercial properties transacted over the past 12 months in deals of $500,000 and up.

This analysis is part of a series of reports on the commercial market, which will include a look at neighborhoods by the dollar volume of sale transactions, loan transactions and development.

Of the top 50 most active neighborhoods, 24 were in Brooklyn, 13 were in Manhattan, nine were in Queens and three were in the Bronx.

Most active NYC neighborhoods by number of tax lots sold over past 12 months

wdt_ID Borough Neighborhood Number of tax lots Dollar volume Number of transactions Number of buildings sold Commercial tax lots Percent sold Average tax lot sale price
1 Brooklyn Williamsburg 197 1,643,937,014 178 203 4,806 4 8,344,858
2 Brooklyn Bedford-Stuyvesant 154 413,620,197 142 162 5,771 3 2,685,845
3 Brooklyn Bushwick 142 918,669,864 131 138 4,938 3 6,469,506
4 Queens Astoria 139 853,243,057 109 145 4,280 3 6,138,439
5 Manhattan Harlem 112 502,219,266 60 114 4,106 3 4,484,101
6 Queens Flushing 105 445,774,537 90 113 2,526 4 4,245,472
7 Brooklyn East Flatbush 99 175,148,939 94 114 3,635 3 1,769,181
8 Queens Ridgewood 97 197,793,067 89 111 2,794 4 2,039,104
9 Queens Long Island City 91 1,390,706,624 76 96 2,356 4 15,282,490
10 Manhattan Upper West Side 89 1,061,724,932 74 92 2,516 4 11,929,494
11 Brooklyn Greenpoint 88 451,837,336 77 95 2,695 3 5,134,515
12 Brooklyn Borough Park 79 196,656,622 75 83 2,914 3 2,489,324
13 Brooklyn Gravesend 78 172,749,794 68 102 2,066 4 2,214,741
14 Brooklyn Sunset Park 76 307,255,613 70 78 3,187 2 4,042,837
15 Brooklyn Crown Heights 75 231,295,445 70 78 3,888 2 3,083,939
16 Manhattan Lenox Hill 72 1,594,100,760 57 81 2,050 4 22,140,288
17 Brooklyn Bay Ridge 71 485,132,905 68 87 2,396 3 6,832,858
18 Queens Maspeth 70 502,254,659 61 78 1,996 4 7,175,067
19 Brooklyn East New York 64 611,394,284 46 100 3,649 2 9,553,036
20 Brooklyn Sheepshead Bay 64 191,898,372 57 72 2,258 3 2,998,412
21 Brooklyn Bensonhurst 61 218,054,246 60 64 2,129 3 3,574,660
22 Queens Jamaica 60 225,971,279 46 66 2,788 2 3,766,188
23 Brooklyn Brooklyn Heights 58 220,300,610 58 58 659 9 3,798,286
24 Bronx Longwood 54 179,322,643 24 57 1,101 5 3,320,790
25 Brooklyn Dyker Heights 54 103,534,301 51 64 1,165 5 1,917,302
26 Manhattan East Harlem 53 454,341,933 36 52 2,384 2 8,572,489
27 Brooklyn Flatbush 52 261,315,483 49 58 2,094 3 5,025,298
28 Manhattan East Village 51 474,584,623 42 63 1,164 4 9,305,581
29 Brooklyn Midwood 51 340,730,335 49 52 1,443 4 6,680,987
30 Manhattan Yorkville 50 526,481,849 35 52 1,183 4 10,529,637
31 Manhattan Chelsea 49 1,660,280,307 43 51 1,411 4 33,883,272
32 Manhattan Hell's Kitchen 49 974,102,458 40 58 1,275 4 19,879,642
33 Manhattan Washington Heights 48 322,436,754 41 43 1,904 3 6,717,432
34 Bronx Mott Haven 48 496,249,060 44 54 1,594 3 10,338,522
35 Brooklyn Park Slope 46 260,155,997 43 49 1,374 3 5,655,565
36 Manhattan Greenwich Village 44 446,772,901 35 50 1,124 4 10,153,930
37 Brooklyn Greenwood Heights 43 161,812,257 38 39 940 5 3,763,076
38 Manhattan Financial District 42 2,147,483,647 25 46 909 5 68,791,594
39 Manhattan Lincoln Square 41 2,139,491,103 29 46 518 8 52,182,710
40 Brooklyn East Williamsburg 41 246,065,403 34 53 1,445 3 6,001,595
41 Queens Elmhurst 38 167,708,626 34 40 1,583 2 4,413,385
42 Queens South Ozone Park 38 56,738,345 34 39 1,453 3 1,493,114
43 Bronx Belmont/Little Italy 37 126,891,396 32 41 1,052 4 3,429,497
44 Queens Murray Hill (QN) 37 71,044,436 34 41 823 5 1,920,120
45 Brooklyn Cypress Hills 36 69,262,000 31 43 1,568 2 1,923,944
46 Brooklyn Red Hook 36 556,179,113 22 24 746 5 15,449,420
47 Manhattan Lower East Side 35 295,570,754 31 36 1,098 3 8,444,879
48 Brooklyn Gowanus 35 300,079,846 28 40 860 4 8,573,710
49 Brooklyn South Slope 35 253,063,926 30 36 674 5 7,230,398
Borough Neighborhood Number of tax lots Dollar volume Number of transactions Number of buildings sold Commercial tax lots Percent sold Average tax lot sale price

The most active buyers in Williamsburg by number of properties acquired were Corner Street Capital, Joel Schwartz, Firebird Grove and DAX Real Estate, and several more buyers tied. In Bedford-Stuyvesant, the top buyers were Carlyle Group, Alchemy Ventures and Yitzchok Schwartz.

PincusCo reported on six properties Corner Street Capital acquired this year from Joel Schwartz including 58 Palmetto Street, that are anticipated to be part of a 17-building, $166 million transaction.

Williamsburg had the most with 197 tax lots sold totaling $1.64 billion. The volume of tax lots sold represented just over 4 percent of the total of approximately 4,800 commercial tax lots PincusCo is tracking in the neighborhood.

The next most active was Bedford-Stuyvesant, with 154 tax lots sold, but the average per property was much lower resulting in a sales volume of just $413 million, less than 25 percent of the dollar volume of Williamsburg. The 154 properties represented 2.7 percent of the total number of 5,771 properties in the neighborhood.

The average sale price in Bedford-Stuyvesant was $2.6 million per tax parcel, compared with Williamsburg’s average price of $8.3 million. Put another way, only three of the 154 tax lots sold in Bedford-Stuyvesant sold for more than $10 million, while in Williamsburg, 36 properties were above the $10 million threshold.

In Williamsburg, 18 of the parcels were vacant lots, while in Bedford-Stuyvesant, the number was 15.

The analysis included transactions of $500,000 and up which closed between October 1, 2021, and September 30, 2022. Multi-property transactions were pro-rated to each neighborhood using the city’s market value of the block and lot number.

Share this article