
Rent Guidelines Board issues conflicting NOI data for regulated apartments
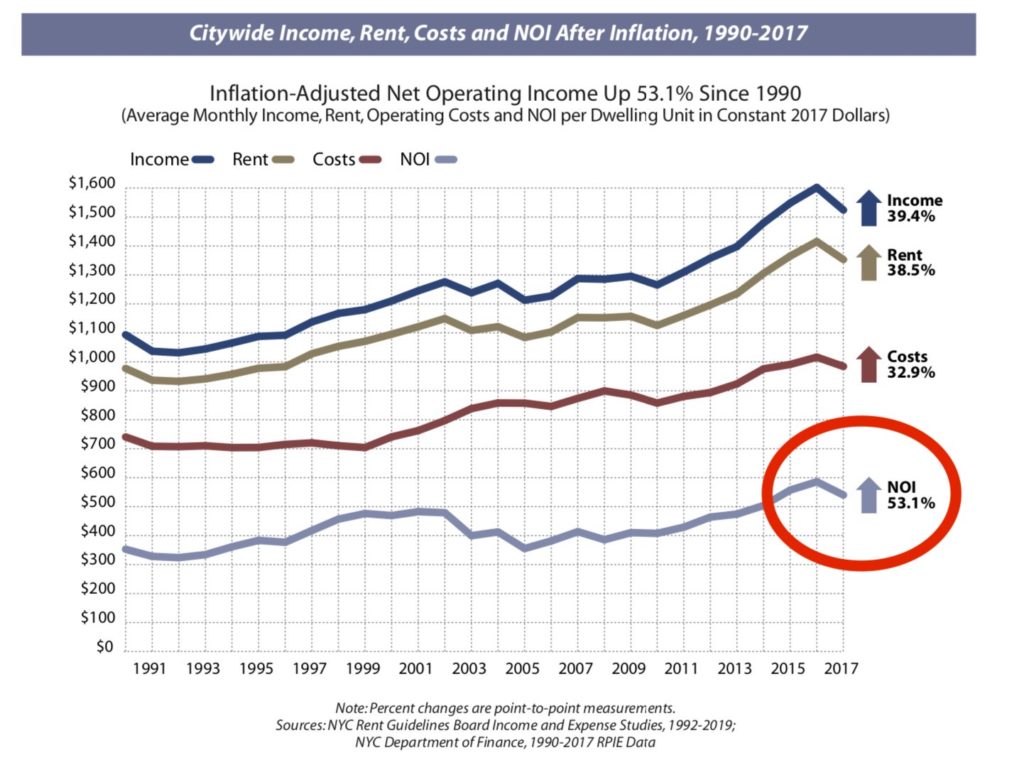
Rent Guidelines Board's cross-sectional analysis of NOI showing a 5 percent decline (red circle added)
One analysis said NOI rose by 0.4%; another showed NOI declined by 5%
By Adam Pincus
The Rent Guidelines Board reported last week that overall, net operating income for New York City rent-regulated landlords rose by 0.4 percent. But it also reported, in the same study, that the NOI for landlords declined by nearly 5 percent, the largest decline since 2005. That decline — nestled in the 31-page report — has not been previously reported.
Whether NOI for landlords rose or fell— whether the 0 percent increases in 2015 and 2016 have in fact hit the bottom line for landlords — is a crucial factor that will be used in the annual bruising public meeting set for June that will determine any increase for rent-regulated housing in the city.
The power the NOI holds in the debate was previewed in comments Assemblymember Harvey Epstein (D-Lower East Side) made to the Daily News this week, when he said the Real Estate Board of New York was “crying wolf” with an analysis that claimed the proposed changes to rent regulations being considered in Albany would undermine the financial health of rent-regulated buildings.
“Even though we did two years of zero percent increases, we saw NOI go up, we saw landlords costs go down,” he said, the Daily News reported.
Well, yes and no.
The RGB’s annual Income and Expense Study is viewed as the essential, non-partisan analysis that both sides — tenant advocates and landlord lobbyists alike — can rely on. It’s the touchstone used to make the billion-dollar decision about how much rents will rise — if at all — in the coming year.
The problem this year is that there are divergent messages within the same report, which each year analyzes the market in two different ways using data from income and expense statements. For the newest report, the data is from calendar year 2017, the first year the 0 percent increase would be fully felt following the 0-percent increases for one-year leases issued in June 2015 and June 2016.
In one analysis, known as longitudinal, the RGB study compared the 2017 data from a group of 14,332 buildings to the 2016 data for the exact same buildings. That analysis found that the overall NOI for the city’s rent-regulated buildings rose by 0.4 percent, and that’s the figure included in the summary the RGB put out with the study.
In addition, the RGB each year takes all the buildings that fit in its methodology — for the most recent study that was 15,395 buildings — and looked at the data as a snap shot, in an analysis known as a cross-section. The information from the cross-section is used to determine average monthly income per unit, operating costs, etc. This data is anecdotally compared that to the data set from last year, which included 15,398 buildings, as well as prior years, in graphs.
Andrew McLaughlin, executive director of the RGB, said the longitudinal study was more dependable for the NOI analysis because it’s comparing the same exact buildings year over year.
He noted as well that for the cross-sectional data set, “last year the sample included BBLs [the acronym for the city’s property identification system, borough, block and lot] with more than one building, but the unit counts for only a single building. Some of the averages for rent and costs and income are different.”
Even as the RGB says that the longitudinal data is more dependable as a data set for comparison purposes, the majority of the RGB report is the cross-sectional data, frequently comparing data from this year to prior years.
The chart from the cross-sectional analysis in the report shows the decline in NOI illustrated with the grey line, highlighting the drop from an average of $568 per unit per month in 2016, to $540 per month in 2017.
Oddly, even as the RGB says the longitudinal study is more dependable, it does not include a chart of the NOI data, just a table.